 There’s no question that virtual training is here to stay. The bigger and better question is, how do we ensure it’s a successful learning method? This year’s State of Virtual Training Survey provides insights and recommendations for organizations around the globe who want to do it well.
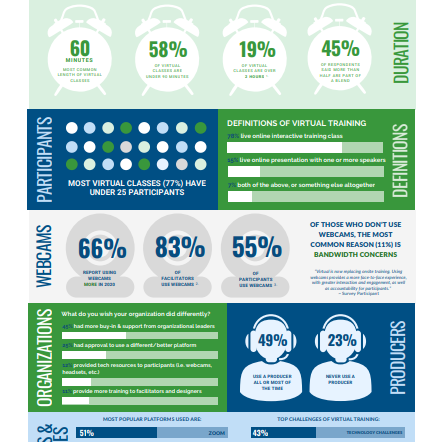
Just over 700 responses poured in for this year’s survey, which was conducted in the July-October timeframe. The results are summarized in the following infographic, which is also available for download.
This is my fourth year in a row asking these questions (plus a few new ones added in). So in addition to these static numbers, the trends are both revealing and exciting. Here’s my analysis of the results, along with specific recommendations for your organization to implement.