 There’s no question that virtual training is here to stay. The bigger and better question is, how do we ensure it’s a successful learning method? This year’s State of Virtual Training Survey provides insights and recommendations for organizations around the globe who want to do it well.
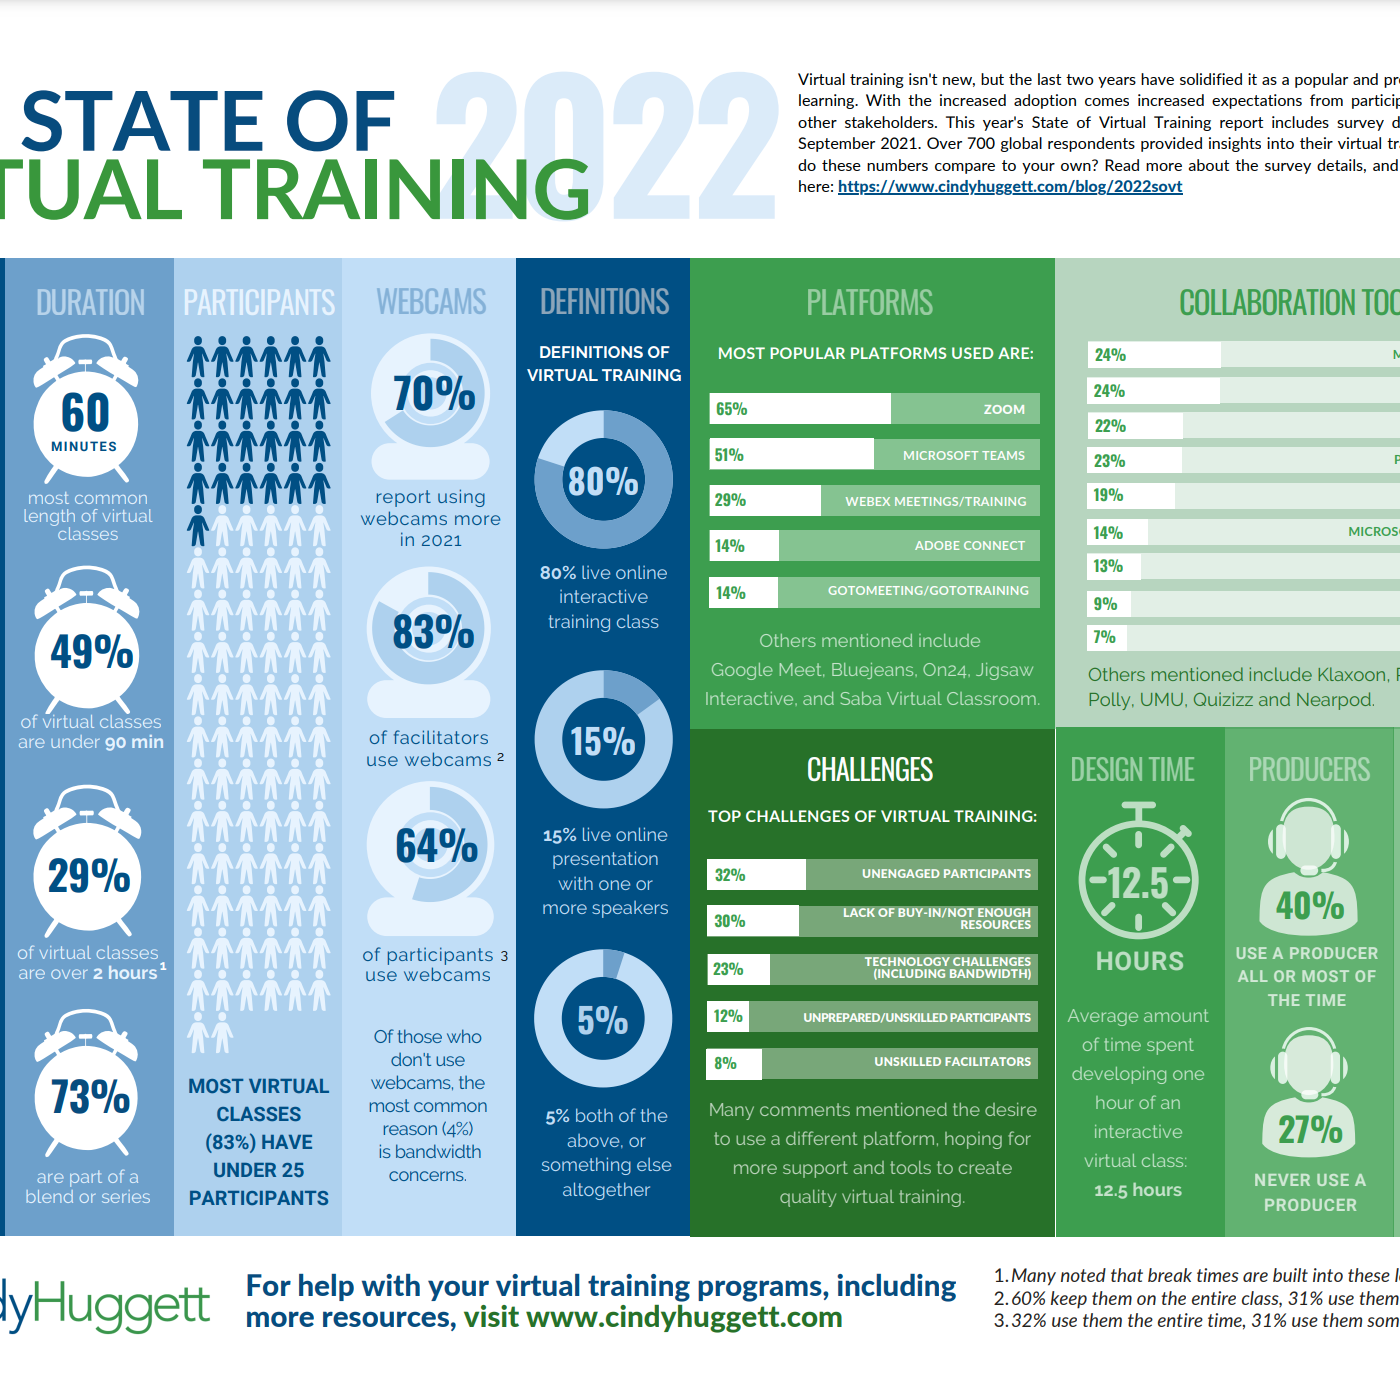
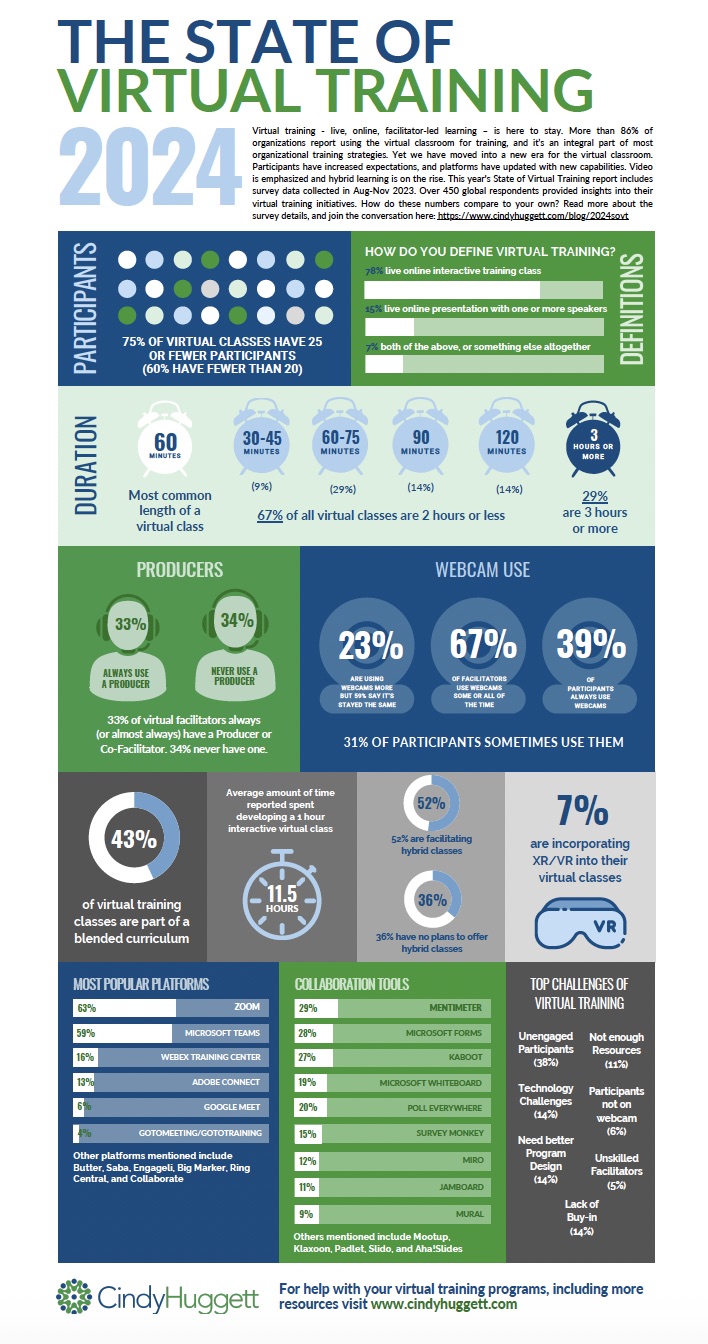
Just over 450 responses poured in for this year’s survey, which was conducted in the Aug-Nov 2023 timeframe. The results are summarized in the following infographic, which is also available for download.
I’ve been asking these questions (plus a few new ones added in) since 2018. So in addition to these static numbers, the trends are both revealing and exciting. My full analysis can be found on my blog here.